| Economic Growth
Economic growth is an increase in the productive potential of a country and
can be shown by an outward shift in the PPF curve. Such a shift can be caused
by an increase in the quantity or quality of factors of production. For example
a better educated labour force, improved technology, the discovery of a new oil
field.
Another way in which economic growth can occur is through
specialisation, or division of labour.
 There
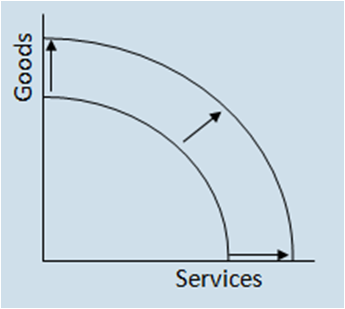
are 2 changes that a PPF can undergo during economic growth, a parallel shift
(shown right) There
are 2 changes that a PPF can undergo during economic growth, a parallel shift
(shown right) 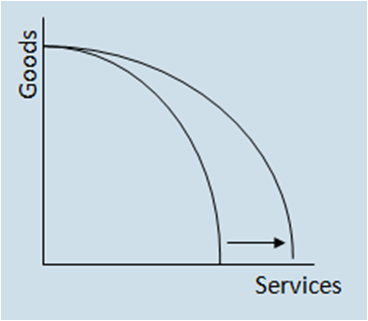 when the there is a general rise in the quantity or quality of
all factors of production. This means that the economy can produce more goods and services (in this example) and thus the standard of living should increase. This can be considered economic growth. when the there is a general rise in the quantity or quality of
all factors of production. This means that the economy can produce more goods and services (in this example) and thus the standard of living should increase. This can be considered economic growth.Or
a pivot (shown to the left) which is caused by a change in the productivity of
only one good or service. In this case only services have seen an expansion; perhaps this is because of a new technology which improved the quantity of output in the service industry but didn't help the goods industry.
An increase in the quantity of the factors of production would have the effect of shifting the PPF curve. Ways for this to occur include labour increasing through migration into a country; as there would be more labour. It is important to remember that although a baby boom would have this effect in the long run it wouldn't be the case in the short run. For land to increase there would have to be a discovery of more resources; for example discovering a new oilfield or coal mine. For capital to increase investment would have to be partaken (the opportunity cost being the production of consumer goods) to increase the capital stock.
The PPF can also shift inwards,
usually only if there is a natural disaster such as a tsunami which destroys
capital and land and reduces the amount of labour available thus reducing the
potential production of a country. A natural disaster may lead to a reduction in the workforce (through fatalities or casualties) and thus less labour, it may destroy land or it may result in the destruction of capital goods if machines and factories are destroyed. All of these factors would cause a leftward shift of the PPF curve.
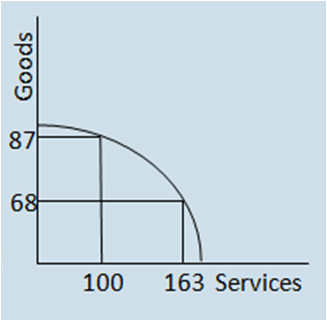 We
can determine the opportunity cost from a PPF curve. From the PPF graph below
we can see that at A 87 goods and 100 services are produced, whereas at B only
68 goods and 163 services are produced. Therefore
if we moved from A to B then the opportunity cost of producing 163 services (a
gain of 63 additional services) would be 13 goods (87-100). We
can determine the opportunity cost from a PPF curve. From the PPF graph below
we can see that at A 87 goods and 100 services are produced, whereas at B only
68 goods and 163 services are produced. Therefore
if we moved from A to B then the opportunity cost of producing 163 services (a
gain of 63 additional services) would be 13 goods (87-100).
Diminishing
Returns
The law of diminishing returns is also known as the law of diminishing marginal returns. PPFs are usually drawn as concave curves due to an effect
called Diminishing Returns. As we move down a PPF curve we give up relatively
more Goods for a smaller increase in the number of Services (in this example), therefore the
opportunity cost is high. This effect is the same if you are looking from
Services to Goods.
Each successive unit of an input, such as labour or capital, brings a smaller increase in output that the previous unit of input. Remember that it is marginal and hence diminishing returns acts on every marginal (one more) unit of input, also it may not necessarily happen on the first few. This means one could potentially add a few extra units of input to the production before the effects of diminishing marginal returns is noticed.
If a PPF is drawn as a straight line it means that the return
is constant. For every extra unit of Good B produced the same unit of Good A
cannot be produced (the opportunity cost). This means there is an equal opportunity cost; by producing one unit of Good A, the opportunity cost is one unit of Good B.
Example
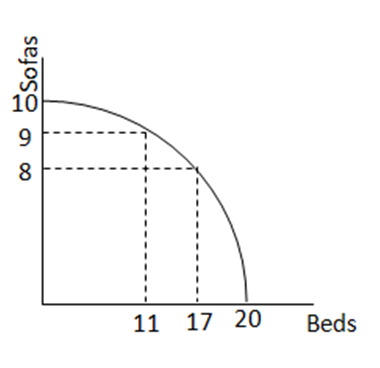 I have my own company that can produce either beds of sofas. I have a fixed amount of labour and we can see from the graph to the right the PPF for my company. If all my inputs (workers, machines, factories and raw materials) were focused on producing beds then we can see from the PPF that I could produce 20 beds and 0 sofas. Conversely if I focused all my inputs on producing sofas then we can see that I could make 10 sofas. If I were to move a worker to the production of beds (from sofas) then I could make 9 sofas but I would be able to make 11 beds. The opportunity cost of 1 sofa is 11 beds. This seems pretty good so I decide I will move another worker from producing sofas to producing beds. I can now make 8 sofas but only 17 beds. This means the current opportunity cost of 1 sofa is only 6 beds whereas before the opportunity cost was 11 beds. I have my own company that can produce either beds of sofas. I have a fixed amount of labour and we can see from the graph to the right the PPF for my company. If all my inputs (workers, machines, factories and raw materials) were focused on producing beds then we can see from the PPF that I could produce 20 beds and 0 sofas. Conversely if I focused all my inputs on producing sofas then we can see that I could make 10 sofas. If I were to move a worker to the production of beds (from sofas) then I could make 9 sofas but I would be able to make 11 beds. The opportunity cost of 1 sofa is 11 beds. This seems pretty good so I decide I will move another worker from producing sofas to producing beds. I can now make 8 sofas but only 17 beds. This means the current opportunity cost of 1 sofa is only 6 beds whereas before the opportunity cost was 11 beds.
This is the law of diminishing returns in action - The first time I direct inputs towards producing something else I see a large marginal benefit (one unit of input may produce a relatively large amount of output) however as I continue to move inputs the marginal benefit decreases. Moving 1 worker from sofas to beds gives me a marginal benefit of 11 beds, whereas moving 2 workers from sofas to beds means I only see a marginal benefit of 6 beds (although in total I am producing 17 beds but the extra output that one new worker produced was only 6 beds). The law of diminishing returns means that as I move even more workers from sofas to beds, lets say I now have 3 workers producing beds, I will see an even small marginal benefit. A possible reason for this is that I have only one machine for making beds. If I have 1 worker making beds then the machine is being operated and so I can produce quite a few beds. If I put another worker to making beds then he may have to wait for the machine to finish and so can produce less that the initial worker. It is a bit like the situation in which 'too many cooks spoil the broth'. If I have a lot of workers producing beds then they may have to be waiting idle for the machine to produce the beds; therefore their productivity will be low. If I get a right balance I could be producing the ideal amount of sofas and the ideal amount of beds in order to maximise output with my inputs.
Page last updated on 20/10/13
| 


