| Price Elasticity of Demand (PED)
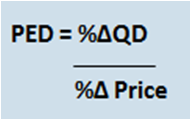
PED
is a measure of how quantity demanded changes in response to a change in price.
It is a measure of responsiveness or sensitivity to price change.
The PED would give a co-efficient not a percentage and it would
always be negative due to the negative correlation of demand.
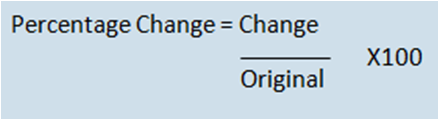
To find the %Δ of Price
or Quantity Demanded you would use the percentage change formula:
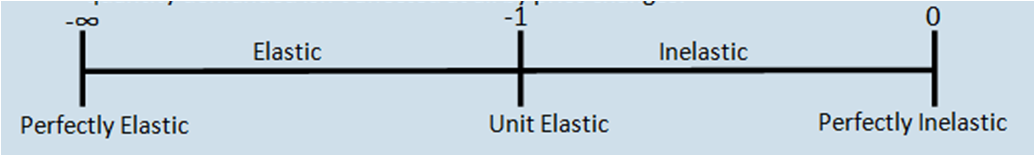
If the elasticity is less than -1 then it is price elastic, the
smaller the number the more elastic the price. Therefore the more elastic a product
is, the more responsive a consumer is to a change in price. So the greater the
elasticity the greater the response to a change in price resulting in a much
greater change in quantity demanded.
If the number is greater than -1 then it is price inelastic.
This means that the quantity demanded of the product will remain relatively
constant regardless of the price changes.
If the number is -1 exactly then it is unit elasticity, where
for each unit of price change there is the opposite unit change in quantity
demanded. ∞ is perfectly elastic (but theoretical), where
the quantity demanded will fall regardless of any price change. On the other
hand 0 is perfectly inelastic as the quantity demanded isn’t affected at all by
price changes.
It is important to note that the elasticity of the curve is the same along the whole curve. One could say a curve is elastic or inelastic relative to another curve if the inelastic curve is more vertical. Conversely if one curve is more horizontal than another it could be described as more price elastic in demand. Also the elasticity is the same for one of the 3 special curves; perfectly elastic, perfectly inelastic and unit elastic.
When talking about curves this could include a straight line; it is still considered a curve.
Total Revenue with Elastic Goods
|
|
Price Elastic Demand |
Unitary Elastic Demand |
Price Inelastic Demand |
|
Price Increases |
Total Revenue Decreases |
No change in Total Revenue |
Total Revenue Increases |
|
Price Decreases |
Total Revenue Increases |
No change in Total Revenue |
Total Revenue Decreases |
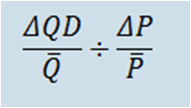
Measurement of Elasticity - Arc Elasticity
One method in which one can measure the changes in elasticity for a specific demand curve is to use arc elasticity. Arc elasticity allows one to describe the elasticity between two defined points on a curve. The formula for arc elasticity is known as the average (or midpoint) formula for price elasticity of demand:
Where q bar and p bar are the average Price and Quantity. This can be calculated by adding the price of point 1 and point 2 and dividing by 2. P bar = ((P1+P2)/2). Delta QD is the change in quantity demanded. Check the example below.
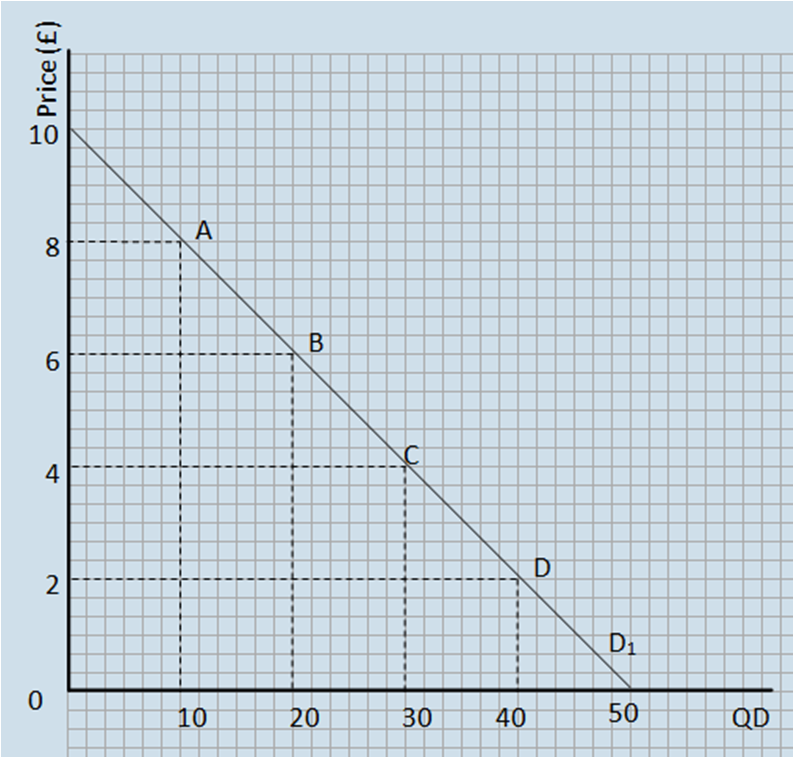
Example 1
To calculate the the elasticity between A and B:
The change in QD = 10 (10 to 20)
The change in P = -2 (8 to 6)
The average quantity demanded between A and B = 15 (10+20 / 2)
The average price between A and B = 7 (8 + 6 / 2)
We then substitute these values into our formula and we get a value of -2.33. We can then find out what elasticity this constant has. Because it is smaller (<) -1 it is therefore elastic. Therefore we can conclude that the curve is elastic between points A and B.
To calculate the elasticity between B and C:
The change in QD = 10
The change in P = -2
The average quantity demanded between B and C = 25
The average price between B and C = 5
This gives us an answer of -1 from our formula. Therefore the curve is unit elastic between B and C.
To calculate the elasticity between C and D:
The change in QD = 10
The change in P = -2
The average quantity demanded between C and D = 35
The average price between C and D = 3
Our formula returns an answer of -0.42857, this means between C and D the curve is inelastic.
This example also demonstrates the different elasticities between points.
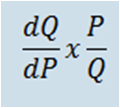
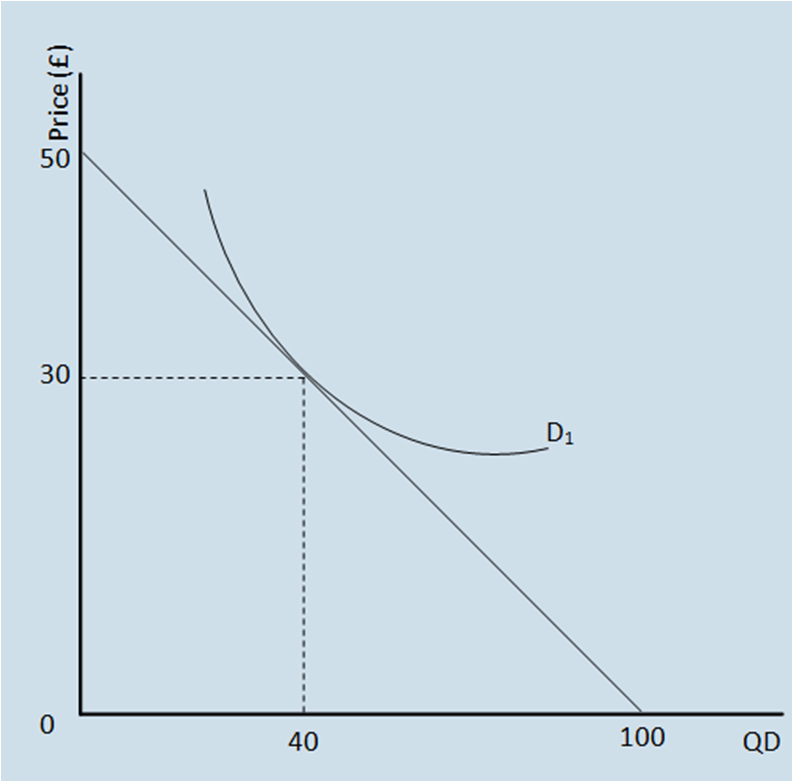
Point Elasticity
This method allows one to measure the elasticity of a single point. The formula for this is:
Where dQ/dP is the differential of the demand curve. If the demand curve isn't given then a tangent to the point can be drawn. The gradient of the tangent of this curve is the differential of the point.
Example 1
We have drawn a tangent to the point A. The gradient of the tangent is 100/50 (always do it in terms of Q/P as this is what the point elasticity formula requires) which is 2. This number is negative because it is a negatively sloping curve. Hence dQ/dP = -2. We would then substitute this into the rest of our formula. -2 * (30/40) = -1.5 therefore the point A is elastic in demand as it has an elasticity of -1.5.
PED
Determinants
Substitutes – if there
are a lot of alternatives that are similar, then a product is likely to be more
elastic. This is because if the price of a good rose, then consumers could easily
switch to a substitute. it also depends on how similar the substitutes are. For an orange there may exist 3 different 'brands' that sell it, however the product is still an orange! Because the good is the same, if one brand were to increase its prices and the others were to remain the same then consumers would purchase the cheaper brand as it is still an orange! The closer the substitute goods are then the more elastic the product will be.
Time – Demand
for any good tends to be inelastic in the short run but elastic in the long
run. People may not instantly be able to change products as soon as the price
changes. For example with petrol, if the price went up in the short run demand
wouldn’t really change. In the long run however it might decrease as people
look to other forms of energy.
Proportion
of Budget – Consumers are more likely to be sensitive to price changes
on expensive goods as oppose to cheaper goods. Therefore normal goods and more
expensive goods are more likely to be elastic than inferior goods and cheaper
goods that are likely to be inelastic. This is because with a cheap product a
small price change is unlikely to deter consumers from switching to substitutes.
Whereas expensive goods a price change is likely to increase the price quite
significantly and so this will deter people from buying the good.
Page last updated on 20/10/13
|