Equilibrium
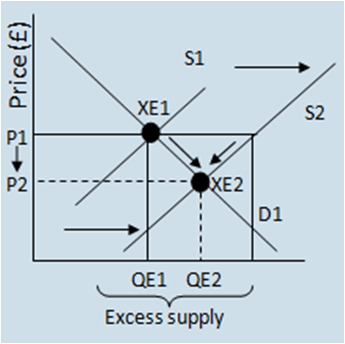
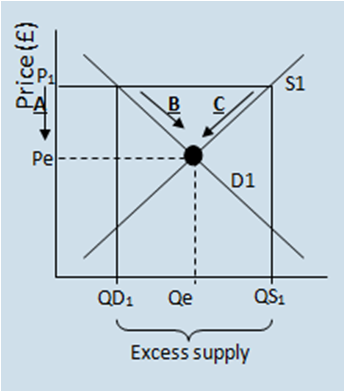 The equilibrium is the balance between supply and demand. It is always the intercept between the supply curve and the demand curve. It is a point where demand exactly meets supply and shows the price needed to accomplish this. In reality the equilibrium price is constantly changing. The equilibrium is the balance between supply and demand. It is always the intercept between the supply curve and the demand curve. It is a point where demand exactly meets supply and shows the price needed to accomplish this. In reality the equilibrium price is constantly changing.From the graph above we can see that the price was at P1, thus supply would have been at QS1, and demand at QD1, there would have been disequilibrium because QD1 is less than QS1, so there was excess supply.
The market always corrects itself to return to the equilibrium price. Because there is excess supply (a surplus) the suppliers want to sell their stock, and so to do this they reduce their price to sell them (stage 1 - A). This would result in demand increasing, an expansion in demand (stage 2 – B). Because the price has decreased it is less profitable to be supplying the good and so supply will be reduced (stage 3 – C). Firms continue to do this (reduce the price) until there is no more excess supply and the equilibrium point (Qe and Pe) have been found (in effect demand has caught up with the supply).
This is known as the operation of the price mechanism.
Conversely a similar thing happens when the price is too low and demand exceeds supply 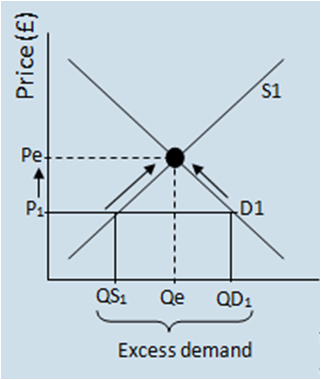 (excess demand). As we can see from the graph (right) the price is at P1, this causes a high demand, which supply can’t meet (its not very attractive for suppliers to have high supply at this low price). There is disequilibrium as there is more demand than supply ( excess demand). Because there is more demand than supply there will be shortages, this will lead to the price of the good being increased. This will mean demand will be reduced (a contraction in quantity demanded). Since the price has increased it becomes more attractive to suppliers who increase supply (an extension in quantity supplied). This will occur until equilibrium is found where the increase in supply matches the demand.
Shifts in Supply and Demand on Equilibrium
Shifts in supply and demand mean a new equilibrium price will have to be found.
Positive Shift in the Demand Curve
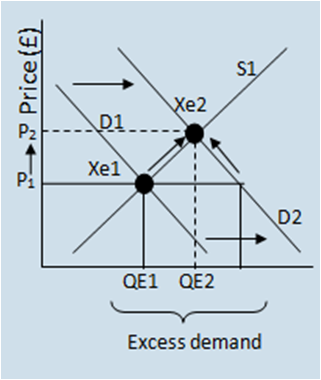 The rightward shift of the demand curve would cause an excess in demand at the original price (P1) which would lead to the price increasing. This makes the market more attractive for suppliers who will extend their supply. Demand will fall at the higher prices (a contraction in quantity demanded). This will continue to occur (the price rising and the extension in supply) until a new equilibrium is found, where demand is equally met by supply. This might occur because of a rise in real income, a rise in the price of substitutes, an increase in popularity or a fall in the price of a complementary good. The rightward shift of the demand curve would cause an excess in demand at the original price (P1) which would lead to the price increasing. This makes the market more attractive for suppliers who will extend their supply. Demand will fall at the higher prices (a contraction in quantity demanded). This will continue to occur (the price rising and the extension in supply) until a new equilibrium is found, where demand is equally met by supply. This might occur because of a rise in real income, a rise in the price of substitutes, an increase in popularity or a fall in the price of a complementary good.
Negative Shift in the Demand Curve
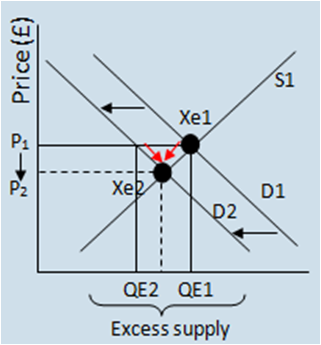 The leftward shift of the demand curve would cause an excess in supply which would lead to the price falling as suppliers try to sell their stock. As the price falls demand will increase (an extension in demand) whilst some suppliers will exit the market (a contraction in supply). This will continue to occur until a new equilibrium is found, where supply is equally met by demand. This might occur because of a fall in real income, a fall in the price of substitute goods, a rise in the price of a complementary good, a fall in the population or reduced advertising/marketing.
Positive Shift in the Supply Curve
 The rightward shift of the supply curve would cause an excess in supply which would lead to the price falling as suppliers try to sell their stock. As the price falls demand will extend whilst some suppliers will exit the market or reduce their supply (a contraction in supply). Therefore a new equilibrium will be found. Reasons why the supply curve might positively shift include; a fall in wage costs, a fall in material costs, improved labour productivity, reduced indirect taxes, increased subsidies, increase technology and entry of new firms into the industry (NB – entry of new firms into the industry would cause a positive shift as there would be more supply available in general, nothing to do with individual firms competing). The rightward shift of the supply curve would cause an excess in supply which would lead to the price falling as suppliers try to sell their stock. As the price falls demand will extend whilst some suppliers will exit the market or reduce their supply (a contraction in supply). Therefore a new equilibrium will be found. Reasons why the supply curve might positively shift include; a fall in wage costs, a fall in material costs, improved labour productivity, reduced indirect taxes, increased subsidies, increase technology and entry of new firms into the industry (NB – entry of new firms into the industry would cause a positive shift as there would be more supply available in general, nothing to do with individual firms competing).
Negative Shift in the Supply Curve
The leftward shift of the supply curve would lead to excess demand, and so prices will rise. 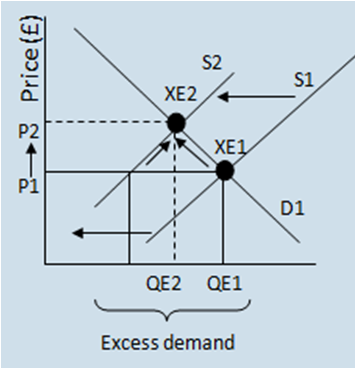 As prices rise supply will gradually increase (an extension in quantity supplied) whilst demand will contract). This will continue to occur until equilibrium is found. Reasons why the supply curve might shift include; a rise in wage costs, a rise in raw material costs, reduced labour productivity, an increase in indirect taxes, a reduction in subsidies and the exiting of firms from an industry.
Positive Shift in the Demand and Supply Curve
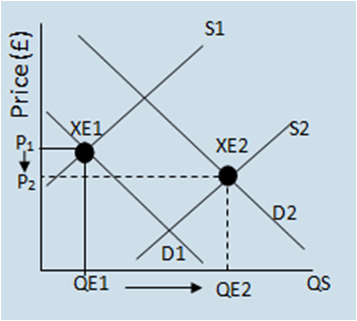
The demand curve and the supply curve have both positively shifted. An example of this occurring is with the computer market. Demand has increased due to marketing, and an increase in real incomes, supply has increased due to dramatic reductions in costs and increases in technology. The price is reduced but the overall equilibrium point increases (more is supplied which is met by demand).
Page last updated on 20/10/13
|


