Income
Distribution
Income distribution explains how the income in a country is
distributed between quintiles of the population. Ways of measuring income
distribution and comparing it between other countries include the Lorenz Curve,
the Gini Index and the Kuznets Curve.
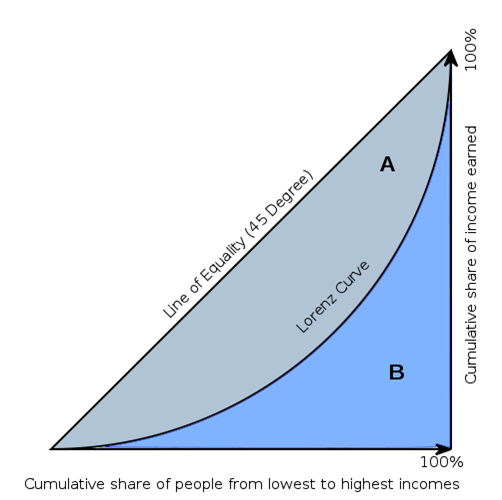
The Lorenz Curve
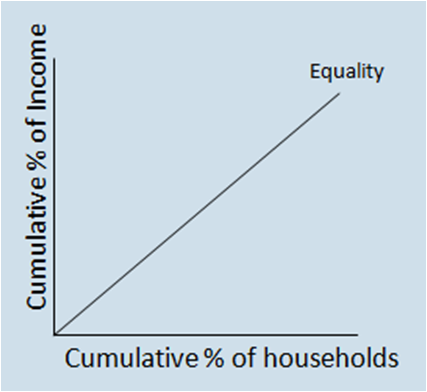 The Lorenz curve is a graphical way of depicting the distribution of income within a country. It can be calculated by splitting the population up into 5 quintiles measuring their income, calculating their percentage of total income and calculating the cumulative percentage of income. This can then be plotted on a Lorenz Curve. The Lorenz curve is a graphical way of depicting the distribution of income within a country. It can be calculated by splitting the population up into 5 quintiles measuring their income, calculating their percentage of total income and calculating the cumulative percentage of income. This can then be plotted on a Lorenz Curve.
From the curve to the left we can see that the line of equality has a gradient of exactly 1. This line represents equality, where each quintile (group of the population) earns the same amount of income as the percentage of the entire population in their quintile.
The Gini Index
The Gini coefficient can be calculated using a formula.
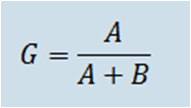
The values of this can then be plotted and it is easier to make
a comparison between countries. The closer the value is to 1 the more unequal
the income distribution and conversely the closer to 0 the more equal the
income distribution.
The Kuznets Curve
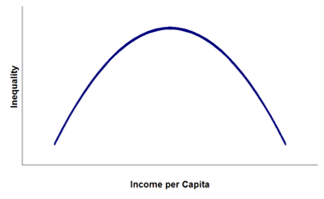 The Kuznets curve shows the theory that there is a relationship between the degree of inequality in the income distribution and the level of development that a country has achieved.
It is believed that at early stages of economic development income is fairly equally distributed, with everyone living at relatively low income levels. As development begins there are some individuals who gain a lot and their incomes will rise more rapidly. Therefore in this middle phase the income distribution will tend to worsen. At a later stage of development society will begin to redistribute income. This is shown on the curve (income being measured by the Gini Index).
Page last updated on 20/10/13
|