|
The Laffer Curve
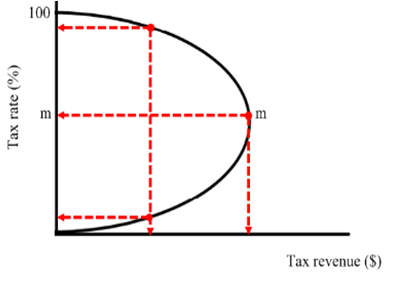 The Laffer curve is a diagram illustrating the effects of the level of taxation and the revenue gained from this taxation. From the graph we can see that at a tax level of 0% and 100% no revenue is attained. This is because at 0% the government wouldn’t collect any money and at a 100% there would be absolutely no incentive to work as an individual wouldn’t gain anything out of it. Theoretically there is a point, m, at which an optimal amount of revenue would be collected. This means that raising the tax rate above m would be counterproductive and would result in earning less tax revenue. The same applies for decreasing the tax rate. Although m appears to be at a rate of 50% this isn’t necessarily true and could be elsewhere. The Laffer curve is a diagram illustrating the effects of the level of taxation and the revenue gained from this taxation. From the graph we can see that at a tax level of 0% and 100% no revenue is attained. This is because at 0% the government wouldn’t collect any money and at a 100% there would be absolutely no incentive to work as an individual wouldn’t gain anything out of it. Theoretically there is a point, m, at which an optimal amount of revenue would be collected. This means that raising the tax rate above m would be counterproductive and would result in earning less tax revenue. The same applies for decreasing the tax rate. Although m appears to be at a rate of 50% this isn’t necessarily true and could be elsewhere.
High tax rates could prohibit growth if individuals don’t have an incentive to work hard or to innovate and create products, for firms it could mean not investing in the economy and expanding operations. This means that little money is generated and hence the government don’t receive a large revenue return from it. At high tax rates people may also try to evade paying, this can be done through loopholes or illegally. On the other hand low taxes might encourage growth, investment and spending thus increasing GDP but the government would have a smaller percentage of this. However they might receive more money than if the tax rate is higher. Therefore lower tax rates may generate more tax revenue than lower tax rates.
The area above m is known as the prohibitive range where you limit output and lose revenue.
Page last updated on 20/10/13
|