| Inflation
Inflation is defined as a change in the overall level of prices in an economy. The first step in measuring inflation is to measure the average level of prices in the economy. Inflation is then calculated as the percentage rate of the change of prices over time. There are 2 main types of price indexes; CPI and RPI.
The Consumer Price Index (CPI) is a price index used by the government to set its inflation targets since 2004. The index is based on the prices of about 650 goods and services measured at different points in time. These are obtained through the Family Expenditure Survey. The information is compiled with data about the prices of goods and services in the bundle collected on a monthly basis from a sample of 7,000 households across the country. The weights (number of goods that are bought, e.g. 4 loafs of bread a week) for the items included in the index are meant to reflect the typical spending habits of consumers in the economy. These weights are adjusted each year to meet changing consumption patterns in households. The goods and services also change on a yearly basis to reflect changing consumer habits. Consumers habits change due to new fashion (e.g. in clothes and cosmetics), technology and availability.
The Retail Price Index (RPI) is an alternative measure of inflation. RPIX is the RPI excluding mortgage interest payments. The CPI replaced RPIX because it is believed to be a more appropriate indicator for evaluating policy effectiveness. CPI is also based on the same methodology as other European countries and so can be easily compared. The RPI excludes pensioner households and the highest-income households whereas CPI doesn’t. Also they both contain a different range of items.
If the index for one year is 117, then that means it now costs £117 to buy what initially cost £100 in the base year. Historically the RPI has generally been higher than the CPI, this is due to the different products.
The rate of inflation you hear on the news is usually referring to the rate of inflation over a yearly period. For example CPI inflation in the UK for December 2011 was 4.2%. This doesn't mean that prices have increased by this amount in a month (from November) but that from December 2010 to December 2011 prices have increased by 4.2%.
Inflation is represented mathematically by the pi (π) symbol, and can be calculated as: [(Index Year 2 - Index Year 1)/Index Year 1]*100. If inflation is positive then overall prices in the economy are rising. Higher inflation means a higher rate of price increase. Lower inflation, doesn't mean that prices are falling, merely that the price increase is slower than in a previous year. If inflation is negative then prices are falling and this is known as deflation.
There are 2 main factors that can cause inflation; too much demand in the economy or rising costs. In reality inflation is unlikely to be caused by either demand-pull or cost-push alone, as may well be as a result of a combination of the two.
 Demand pull inflation occurs if there is an increase in aggregate demand, so long as supply isn't perfectly elastic. As we can see from the graph, a rightward shift of aggregate demand increase price levels as well as overall output. This occurs because the suppliers may face higher costs as demand increases, they have to hire more workers and capital to produce goods and services, higher demand for commodities increases the price which will be passed on, and if the economy is doing well then firms may have to tempt employees with higher wages which drives up costs. Accordingly, the amount of demand pull inflation is determined by the increase in AD, and the elasticity of supply (this depends on how much costs rise as a result of increasing output). Demand pull inflation occurs if there is an increase in aggregate demand, so long as supply isn't perfectly elastic. As we can see from the graph, a rightward shift of aggregate demand increase price levels as well as overall output. This occurs because the suppliers may face higher costs as demand increases, they have to hire more workers and capital to produce goods and services, higher demand for commodities increases the price which will be passed on, and if the economy is doing well then firms may have to tempt employees with higher wages which drives up costs. Accordingly, the amount of demand pull inflation is determined by the increase in AD, and the elasticity of supply (this depends on how much costs rise as a result of increasing output).This rightward shift is a single shock causing inflation. Once it has occurred inflation will remain constant unless there are further rightward shifts.
Demand-pull inflation is only likely to happen when the economy is booming and nears the potential output level.
 Cost push inflation occurs due to rising prices. This causes a leftward shift in the aggregate supply curve which reduces real output and increases the price level (inflation). Rising costs for suppliers will generally be passed on to consumers and through a reduction in production. The size of the leftward shift in supply (cutting of production) is determined by the elasticity of demand. The elastic (so more inelastic) the demand curve is, then the smaller the leftward shift of aggregate supply. This is because more of the increased prices can be passed on to the consumer, and so there is less of a need for a reduction in production. However this does result in greater inflation. If the demand curve were completely inelastic, then cost push inflation would only result in inflation, and wouldn't mean a fall in real output because all price increases can be completely passed on to consumers. This isn't the case in reality, so production is likely to fall as a result of price increases for suppliers. Cost push inflation occurs due to rising prices. This causes a leftward shift in the aggregate supply curve which reduces real output and increases the price level (inflation). Rising costs for suppliers will generally be passed on to consumers and through a reduction in production. The size of the leftward shift in supply (cutting of production) is determined by the elasticity of demand. The elastic (so more inelastic) the demand curve is, then the smaller the leftward shift of aggregate supply. This is because more of the increased prices can be passed on to the consumer, and so there is less of a need for a reduction in production. However this does result in greater inflation. If the demand curve were completely inelastic, then cost push inflation would only result in inflation, and wouldn't mean a fall in real output because all price increases can be completely passed on to consumers. This isn't the case in reality, so production is likely to fall as a result of price increases for suppliers.Again, like demand-pull inflation, if there is a single shock (i.e. a tax increases from 20% to 30%) then inflation will increase for one month, but would stabilise in the future unless there are further shocks.
We can distinguish between different reasons for an increase in prices. The following cases occur because a group (e.g. union or firm) is using its economic power to increase prices.
- Wage-push inflation - trade unions push up wages independently of the demand for labour (the market determined rate).
- Profit-push inflation - firms use monopoly power to push prices up in order to increase profits (this is in contravention to the equilibrium rate of supply and demand).
- Import-price-push inflation - import prices rise as a result of a cartel or due to collusion. This is separate from demand but can also be affected by the exchange rates.
Additional causes include:
- Tax-push inflation - increased taxation increases the costs for suppliers or increases the price of the good for the consumer.
- Resource Depletion - the depletion of resources (e.g. commodities) will cause their price to increase, a lot of resources are needed in the production of goods (oil for plastic, raw materials etc) and so an increase in the cost of the resource will be passed on to consumers by suppliers.
As noted before, inflation can be both due to cost-push or demand-pull, for example, unions may demand an increase in wages which causes a shift in the aggregate supply curve (meaning higher price levels and a fall in output and hence unemployment), the government responds by increasing government spending in order to offset the fall in employment due to the higher wages, this will result in yet higher price levels but may mean that output increases slightly. If we were to show these effects on a graph, it would appear that price levels have risen inexplicably whilst output levels have remained constant, we wouldn't be able to tell by simply looking at the graph, the effects which caused it.
Inflation can erode away at living standards and reduce the amount of goods and services one can purchase on a given income. Consumers expect a certain degree of inflation and thus demand higher wages (to ensure that their real wage doesn't fall) and take inflation into account when purchasing goods/services. However expectations aren't always perfect and as such, inflation can have implications for the economy.
- Menu costs - Shops and firms will have to change their prices (labels, catalogue, menus) often which can be expensive. This is particularly expensive for fixed capital such as vending machines and parking meters.
- Shoe leather costs – If inflation is high consumers will shop around more for goods and interest-bearing accounts, this takes up consumers time, which could be spent more productively on leisure or working.
- Redistribution of income - inflation redistributes income from the poor to the rich. Those on fixed incomes such as pensioners and those on benefits may not see there incomes rise in line with inflation. This means that their purchasing power falls. Fiscal drag may mean people on lower incomes (lower and middle class) have to pay more tax resulting in less disposable income, this effects the rich less as they are in the top tax bracket anyway. Income is redistributed from those with savings (assuming inflation is greater than interest rates) to those who have borrowed who should find it more affordable to pay back debt.
Income is also re-distributed because those who whose wealth is stored in assets (houses, shares and commodities), mainly the rich, are likely to see the value of their wealth stay constant, or maybe even rise, whereas people who don't have much wealth are likely to see real incomes fall. This shows the shift of money from the poor - who pay rent and buy goods from shops owned by the rich - transferred to the rich.
- Psychological and Political - Inflation makes people feel worse off even if their incomes rise by more than the rate of inflation. Change and revolution in the past have often accompanied periods of high inflation (but this is usually as a result of hyper-inflation, not ordinary inflation).
- Unemployment and growth - high inflation is likely to lead to uncertainty within businesses who see their costs and revenues fluctuate wildly due to inflation. Because they can't accurately predict what costs and revenues will be then they may decide to withhold investment until the economy outlook is more certain. Another important consideration is if prices rise then this should send a signal to firms to produce more because demand is high. But this rise in price may be as a result of inflation and not increased demand which could lead to allocative inefficiency.
- Balance of payments - High inflation will make a country's exports more expensive to foreigners and hence it will become less competitive. This may result in a fall in exports, meanwhile imports will become relatively cheaper compared to domestic products and so imports may rise. As a result, the balance of payments is likely to worsen.
Inflation isn't bad for everyone, as we have seen it can result in even greater wealth for those holding assets and it is also good for borrowers. But borrowers might not just be people, they can also be governments, high inflation erodes the value of government debt which could help to reduce it. The government should also benefit from higher taxation as a result of fiscal drag, but this may be the cost of automatic stabilisers as the economy slows due to inflation.
Inflation can be beneficial in that it may overcome the effects of downward sticky wages and prices; wages are said to be sticky downward as people don't like taking a wage cut, similarly prices may be sticky downward because wages (which represent a large proportion of the cost of a good/service) are sticky downward because firm's don't wish to forgo profit. If wages and prices are too high in the first place - perhaps making them uncompetitive on the international stage - then inflation will reduce the real wage rate and the real price of goods and services, which will restore international competitiveness without the need to devalue a currency. This can be particularly beneficial for countries with a fixed exchange rate or those part of a currency bloc, i.e. those within the eurozone.
Some inflation is unanticipated; households firms and government are unsure of future inflation rates and so when planning have to estimate the rate. It is unlikely that their estimate will be accurate so their plans will be frustrated. Conversely inflation can be anticipated. This allows households, firms and the government to build this figure into their plans.
Anticipated inflation can be a self-fulfilling prophecy meaning that inflation actually occurs as a result of it being anticipated. Lets say that their is a general assumption that inflation will be around 3%. This means that workers and unions will demand a (minimum) 3% increase in their wage to ensure that they don't loose out in real terms. Assuming that firms give them this rise, they will in turn increase their prices by about 3%, to ensure that they don't loose out in real profit terms and to account for the fact that costs have increased as a result of wage negotiations.
Unanticipated inflation imposes greater costs than anticipated inflation. Economic agents can take steps to mitigate the effects of inflation through indexation. This is where benefits, pensions and tax brackets are increased in line with inflation. This reduces many of the costs of inflation as recipients still retain their percentage of income by receiving benefit/pension increases to offset the change in rising prices. Indexation of tax brackets reduces the pernicious effects of fiscal drag. Although shoe leather costs and menu costs still remain. But indexation may reduce pressure on the government for it to tackle the problem of inflation directly. Indexation eases the pain of inflation but it isn’t a cure for it.
Furthermore, indexation may hinder government attempts to reduce inflation because indexation builds in further cost increases. If a government wants to get inflation down to 2% and it is at 10%, by giving jobseekers a 10% benefit increase as a result of indexation wouldn’t help the government reach its inflation target because demand-pull inflation may occur.
 Is a fall in price levels usually caused by a fall in demand. However deflation further depresses demand. With falling prices consumer confidence tends to be low. Consumers believe that the price of goods will be cheaper in the future and so withhold consumption. This can cause a lack of business confidence and so lowers investment. Although interest rates are usually very low with deflation borrowers actually have to pay back more; the borrowing rate plus the rate of deflation. Is a fall in price levels usually caused by a fall in demand. However deflation further depresses demand. With falling prices consumer confidence tends to be low. Consumers believe that the price of goods will be cheaper in the future and so withhold consumption. This can cause a lack of business confidence and so lowers investment. Although interest rates are usually very low with deflation borrowers actually have to pay back more; the borrowing rate plus the rate of deflation.
The Phillips curve shows the trade-off between unemployment and price inflation as shown by the graph on the left. It is an empirical observation made by Bill Phillips of the relationship between wage inflation and unemployment between 1861 and 1957 in the UK. Wage inflation was generally 2% above price inflation over the period, so we can use the observations to show the relationship between price inflation and unemployment (this is what is shown in the graph), and we can see that the curve is downward sloping.
There are two reason this trade-off exists: firstly, as aggregate demand increases inflation occurs whilst output increases, meaning less unemployment but higher inflation. The second reason is because if nominal wages rose as a result of high inflation then the unemployed may have mistaken this for a real wage increase and hence accept job offers more quickly. It is important to note that in this case, called money illusion (where people mistake higher nominal values as real values, or do not accurately predict the value of inflation), the fall in unemployment only involves frictional unemployment - those who are currently out of work but are in the process of looking for new jobs - members of which might readily take a job if they believe the wage to be high.
The trade-off shows that government policy focusing on low inflation comes at the expense of higher unemployment, whilst government policy focusing on lower unemployment results in higher inflation.
At levels of high unemployment (relatively low employment) we can see that we can reduce unemployment without having a massive effect on price inflation. This is because there is a large pool of unemployed labour who are generally willing to take the jobs. However as unemployment falls, there is a smaller pool of unused labour for firms to draw upon which might mean they have to offer higher wages to entice them to accept the job. This results in wage inflation which eventually filters through to price inflation and explains the reason why the curve is bowed.
The Phillips curve can shift, depending on non-demand factors. Factors which would cause an outward shift (rightwards) include; oil price shocks, expansionary fiscal policy, structural unemployment and higher interest rates. These factors are all non-demand relation and prior to the 1960s the Phillips curve had remained constant for almost a century suggesting that these non-demand factors hadn't changed much over the period.
Leftward shifts can be caused by supply-side policies such as a more flexible labour market and the use of inflationary targets in monetary policy. The reason for this is because supply-side policies shift the aggregate supply curve rightwards meaning the economy can produce more before prices rise, and hence this can be represented on the Phillips curve by a leftward shift of the curve.
The Phillips curve began to break down after 1966, when the UK experience high unemployment along with high inflation, a situation known as stagflation. We will explore why this may have been below.
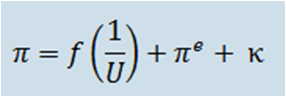
***Milton Friedman incorporated people's expectations about future inflation level into the Phillips curve and this can be expressed by the formula:
Which means that the rate of price inflation (∏) is a function of the inverse of the unemployment rate (1/U) which is stated above + any exogenous (not related to the model) cost pressures on inflation (e.g. increases in commodity prices) which is represented by Κ + the expected rate of inflation (∏^e). Therefore if people believed inflation would be 2%, if demand-pull inflation was 2% and exogenous price rises were 3% then actual inflation would be 7% (these 3 factors added together). ***
Inflation is a major government concern across the Western world. Most central banks are targeted with maintaining a low inflation rate.
Page last updated on 03/08/15
|