The Phillips Curve
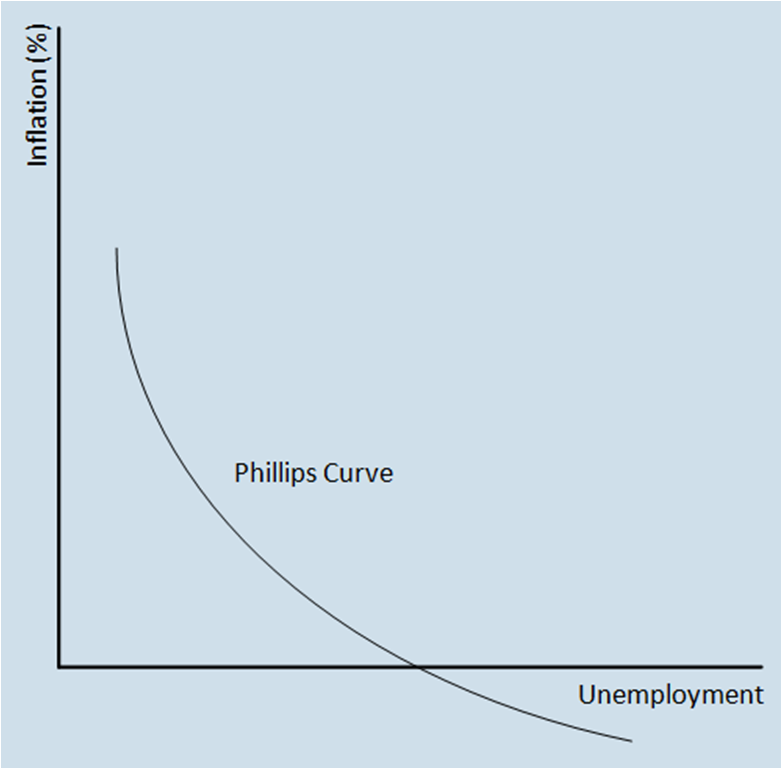 The Phillips Curve shows the relationship between the rate of unemployment and the rate of inflation. We can see that empirically when unemployment is low inflation is high and vice versa. This means there is a trade off between unemployment and inflation. The Phillips Curve shows the relationship between the rate of unemployment and the rate of inflation. We can see that empirically when unemployment is low inflation is high and vice versa. This means there is a trade off between unemployment and inflation.The reason for this is that when the demand for labour is high (thus unemployment is low) firms will be prepared to bid up wages in order to attract labour. This will result in higher wages being passed on in the form of higher prices causing a rise in price levels (inflation). Another reason may be that when inflation is high the unemployed may suffer from money illusion; that is they believe the higher wages they are being offered are real wage rates (when in fact real wage rates may be constant, but inflation may be increasing the monetary value) and hence accept employment more readily.
The curve can be used to show changes in aggregate demand, if AD rises then inflation rises and unemployment falls, hence with an increase in AD there is an upward movement along the Phillips curve. Conversely if AD falls then there's a downwards movement along the curve.
This means that policies with the intent to reduce inflation may lead to higher unemployment.
However after this theory was proposed, there was empirical evidence during the early ‘70’s and late '60's which appeared to contradict this. But it turned out that what had in fact happened was a rightward shift of the Phillips curve. Factors which would cause an outward shift (rightwards) include; oil price shocks, expansionary fiscal policy, structural unemployment and higher interest rates. These factors are all non-demand relation and prior to the 1960s the Phillips curve had remained constant for almost a century suggesting that these non-demand factors hadn't changed much over the period.
Leftward shifts can be caused by supply-side policies such as a more flexible labour market and the use of inflationary targets in monetary policy. The reason for this is because supply-side policies shift the aggregate supply curve rightwards meaning the economy can produce more before prices rise, and hence this can be represented on the Phillips curve by a leftward shift of the curve.
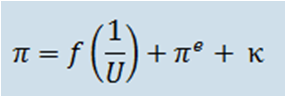
Expectations-Augmented Phillips Curve
Milton Friedman incorporated people's expectations about future inflation level into the Phillips curve and this can be expressed by the formula:
Which means that the rate of price inflation (∏) is a function of the inverse of the unemployment rate (1/U) which is stated above + any exogenous (not related to the model) cost pressures on inflation (e.g. increases in commodity prices) which is represented by Κ + the expected rate of inflation (∏^e). Therefore if people believed inflation would be 2%, if demand-pull inflation was 2% and exogenous price rises were 3% then actual inflation would be 7% (these 3 factors added together).
Page last updated on 20/10/13
|