Subsidy
 A subsidy is an amount of money paid by the government to a supplier to encourage the consumption of a certain good. This is passed on by the supplier to the consumer in the form of a reduced price, causing an expansion in quantity demanded. A subsidy is an amount of money paid by the government to a supplier to encourage the consumption of a certain good. This is passed on by the supplier to the consumer in the form of a reduced price, causing an expansion in quantity demanded.
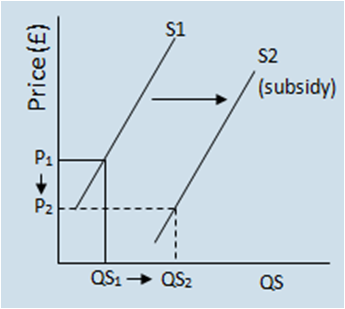
From the graph to the left, we can see the effect of a subsidy on the supply curve. The subsidy causes a rightward (positive) shift of the supply curve, where more of the good is supplied at a lower price. The graph to the left shows a parallel shift meaning the subsidy is a specific subsidy.
From the graph to the right, we can see the effect of an ad valorem subsidy on the supply curve. An ad valorem subsidy is a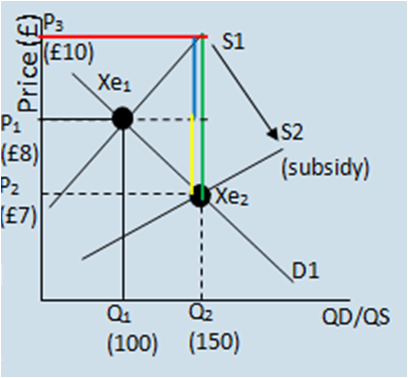 percentage subsidy and so the supply curves aren’t parallel but divergent. As it is percentage based it means the more that is supplied then the higher the subsidy. We can see that there is a rightward shift of the supply curve caused by the subsidy. This leads to excess demand which leads to the price being reduced. percentage subsidy and so the supply curves aren’t parallel but divergent. As it is percentage based it means the more that is supplied then the higher the subsidy. We can see that there is a rightward shift of the supply curve caused by the subsidy. This leads to excess demand which leads to the price being reduced.
To work out the value of the subsidy, we would look at the price that suppliers would demand to supply at Q2 this can be calculated at the point where Q2 and S1 meet (represented by the red line). This is represented by the green line (the whole subsidy). The blue line represents the absorbed subsidy (in the form of profits) and the yellow line represents the amount of the subsidy passed onto consumers.
The original price was £8 where 100 goods were produced. The subsidy resulted in the new price being £7 where 150 goods were produced. That’s an increase of 50 goods with a £1 reduction in the price. This means the supplier passed on £1 of the subsidy to the consumer (the yellow line) calculated by the original price (P1) minus the new price (P2). The subsidy is therefore the price the supplier would demand for 150 goods before the subsidy (on S1 represented by the red line at P3) which is £10 (P3) minus the new price of £7 (P2) therefore the subsidy is £3 per good. The amount of the subsidy absorbed the supplier (in the form of profits) is shown by the blue line and is P3 minus P1 which is £2.
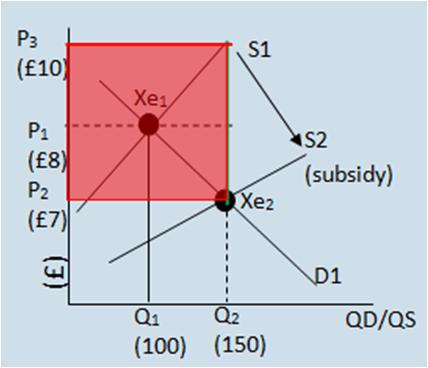 The total expenditure of the government for the subsidy is £3 (the subsidy per good) multiplied by 150 (Q2) which is £450. This is shown as a rectangle (in red). The total profit taken from the subsidy by the supplier is shown as a blue rectangle below - £2 multiplied by 150 (Q2) = £300. The total expenditure of the government for the subsidy is £3 (the subsidy per good) multiplied by 150 (Q2) which is £450. This is shown as a rectangle (in red). The total profit taken from the subsidy by the supplier is shown as a blue rectangle below - £2 multiplied by 150 (Q2) = £300.
With the yellow rectangle showing the total amount of the subsidy passed onto the consumer - £1 multiplied by 150 (Q2) = £150.
Because of this reduced price there is an expansion in Quantity Demanded.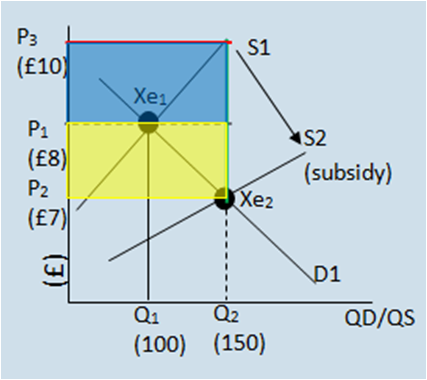
Indirect taxation or subsidies can be used by the government to correct market failures.A subsidy would encourage consumption by reducing the price of the product. This remedy would correct the market failure of externalities. A subsidy would be used to correct a positive consumption externality and encourage the consumption of merit goods.
Advantages
and Disadvantages of Subsidies
The advantage is that they increase the consumption which is
generally considered beneficial (as goods that receive subsidies are usually
merit goods which are under-consumed).
The disadvantage is that there is an opportunity cost to the
government, it may lead to higher taxation or reduced government spending in
other sectors. Also firms may become inefficient in production if they rely
upon subsidies, and the firm may absorb the tax in the form of profits rather
than pass them on to consumers in the form of a price reduction.
Page last updated on 20/10/13
|